
Analysis of Saturday 4th ride.
With the exception of a major technical hitch, Saturdays ride up to that point was well on target. For the more granular, analytical detail to help plan, predict and improve, the data shows a lot of promise. Here's an analysis. In summery:
In ride, the first 20 miles or so settle pretty well and I'm pleased how easily I got into the rhythm and allowed myself to relax while maintaining pace. As the route out has become more and more familiar for riding these roads up to the Humber, expecting certain sections help mentally, I don't have to pay as much attention to navigation and the miles tick by quickly. My cadence felt good, my position was good but not optimal as I find it difficult to be on the bar extensions hour after hour but shoulder pain was minimal.
Up to the break point, I've become more relaxed with "a comfortable ride" distance. 130 miles I was well within my comfort zone and pushing well and maintaining what I felt was around LT in a very controlled manner.
The only minor problem I encounter from the qualitative side was sweat crystallising and chaffing in certain areas. I used a liberal amount of cream but even so, these rides are longer than the average weekend worrier or pro's training ride.
As I didn't get near the exhaustion point, the bits I wanted to report on - the 200 to 300 mile section - I can only guess about especially as the Cambridge through Rutland to Notts section would have had the undulation changes which I find hard when fatigued due to rhythm changes.

The section of data fields I've capped shows the elevation, speed and heart rate. In the heart rate date, my typical variation in the first 30 km is seen before dropping into a steady state. Once into this steady state phase, I held this well until around 138 km where the elevation increases (Lincolnshire Walds) and my legs became more of the limiting factor. My heart rate then decreases through the gradual decent before returning to a steady state again in the Lincolnshire plain in the New York area at around 196 km to the break, For a average HRM over the 7.5 hours was 136 bpm which in in line with the 130-140 bpm target.
By zone, the data looks like this:


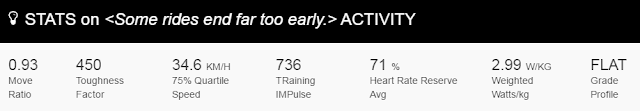
For the total duration my average pace is pegged at 28.5 km/h while the moving average is 31.6 km/h with auto pause kicking in at 5 km/h. From the pace curve which is based on total distance, the minor drops are account for by pauses - such as Brigg for more food, Hornchurch for more water ete - however the rebound and upwards curvature post pause shows that throughout the time period, especially in the southern direction and coming off the Wald, my pace was increasing. The confirms well with the quantitative side (I felt good and comfortable)
For in-ride data, I have/had/do use average pace indicator as a field selection on my Garmin head unit to give me an indication for performance along with a number of other metrics. Through the first 40 km I was mindful of pushing to high an average for the risk being unable to sustain and expected the reduction in average pace in the more undulating sections on the Humber. As such my first 40 km average is 27.6 km/hr as my body builds to steady state and minor halts (junctions) are diluted in the data.
Once through the undulations and onto the apparent slow descent (hardly noticeable on the land!), my average speed in the flat section in the last 20 minutes shows an average pace of 33.2 km/hr with a slight tailwind with a drop in pace shown by traffic lights.


Qualitative
This ride felt good. The major caveat being that this was a lot shorter than planned, but what I did do felt "right." A combination of being well loaded and setting of earlier helped. I had a good nights sleep in terms of bedding early to rise early but I'm still having extreme sweats through the night. From anecdotal observations, it appears that these "glow" periods are more due to food loading which raises the question of liver function. This life style is a little more extreme than most and the cycles of carb loading followed by glycogen depletion can't be doing me any good.In ride, the first 20 miles or so settle pretty well and I'm pleased how easily I got into the rhythm and allowed myself to relax while maintaining pace. As the route out has become more and more familiar for riding these roads up to the Humber, expecting certain sections help mentally, I don't have to pay as much attention to navigation and the miles tick by quickly. My cadence felt good, my position was good but not optimal as I find it difficult to be on the bar extensions hour after hour but shoulder pain was minimal.
Up to the break point, I've become more relaxed with "a comfortable ride" distance. 130 miles I was well within my comfort zone and pushing well and maintaining what I felt was around LT in a very controlled manner.
The only minor problem I encounter from the qualitative side was sweat crystallising and chaffing in certain areas. I used a liberal amount of cream but even so, these rides are longer than the average weekend worrier or pro's training ride.
As I didn't get near the exhaustion point, the bits I wanted to report on - the 200 to 300 mile section - I can only guess about especially as the Cambridge through Rutland to Notts section would have had the undulation changes which I find hard when fatigued due to rhythm changes.
Quantitative
For this ride there's a very distinct cut off point but the ride data to this point looks good.Heart rate

The section of data fields I've capped shows the elevation, speed and heart rate. In the heart rate date, my typical variation in the first 30 km is seen before dropping into a steady state. Once into this steady state phase, I held this well until around 138 km where the elevation increases (Lincolnshire Walds) and my legs became more of the limiting factor. My heart rate then decreases through the gradual decent before returning to a steady state again in the Lincolnshire plain in the New York area at around 196 km to the break, For a average HRM over the 7.5 hours was 136 bpm which in in line with the 130-140 bpm target.
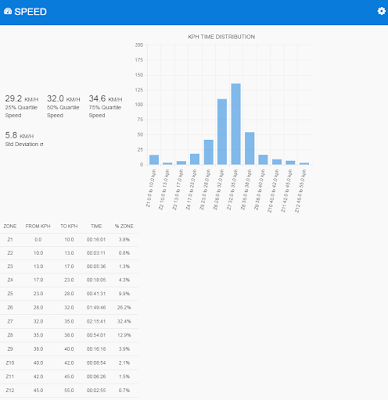
By zone, the data looks like this:

Pace
Pretty chuffed with this. Again, the caveats of this being only over 7.5 hours etc, but this data looks good! It's the data I'm most annoyed about being terminated early.
For the total duration my average pace is pegged at 28.5 km/h while the moving average is 31.6 km/h with auto pause kicking in at 5 km/h. From the pace curve which is based on total distance, the minor drops are account for by pauses - such as Brigg for more food, Hornchurch for more water ete - however the rebound and upwards curvature post pause shows that throughout the time period, especially in the southern direction and coming off the Wald, my pace was increasing. The confirms well with the quantitative side (I felt good and comfortable)
For in-ride data, I have/had/do use average pace indicator as a field selection on my Garmin head unit to give me an indication for performance along with a number of other metrics. Through the first 40 km I was mindful of pushing to high an average for the risk being unable to sustain and expected the reduction in average pace in the more undulating sections on the Humber. As such my first 40 km average is 27.6 km/hr as my body builds to steady state and minor halts (junctions) are diluted in the data.
Once through the undulations and onto the apparent slow descent (hardly noticeable on the land!), my average speed in the flat section in the last 20 minutes shows an average pace of 33.2 km/hr with a slight tailwind with a drop in pace shown by traffic lights.


Predicting
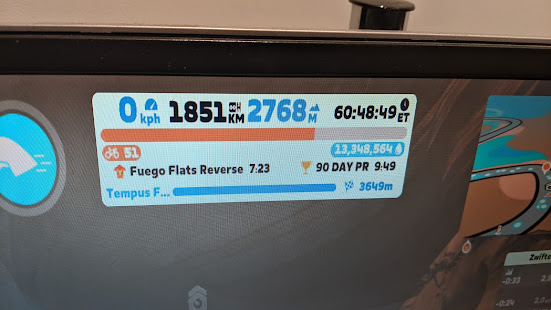
A billion caveats to this as so many variables come into play. Based on the 28.5 km/h average for total ride time, I would cover approximately 684 km or 425 miles - the right ball park! Based on the 31.6 km/hr, I'd do 758 km or 470 miles - more than enough! However this is a data extrapolation from a 7.5 hr ride - 25% of the challenge in terms of distance and time and conditions and support will have a large influence in this.
On Wednesday night, I tested my posh-onsie (Skinsuit) which is clearly going to be faster and more comfortable for the challenge on the spare bike and things look good. I'll have the support car with me for the day so looking to avoid as many stops as possible putting up the move ratio.
From the data seen, the next major training ride (25th June with a 350 mile target) will give a better indication of predictive performance, however the current data is positive although the training rides failure is annoying.
Misc.
- Fork order, delivered and now needs to be fitted.
- Headset still on order
- SiS products arrived
- Carboy for water sorted.
If you've missed it, I'm doing this for charity - please help support!
Comments
Post a Comment